Item Service Console queries
Console App version 3.0 introduced new query functionality to the Item Service Console. After you select a particular application, you will be presented with a list of item classes. For certain item classes, you can now click on an entry in the _id column and drill-down to the new Related Items Query page. This new page allows you to run a range of queries depending on that item type.
This new drill-down query feature is available for all collection type item classes, including:
- Named User Collection
- Named File Collection
- Named Composite Item
- Named Telemetry Collection
Figure: Item Service Console list of items
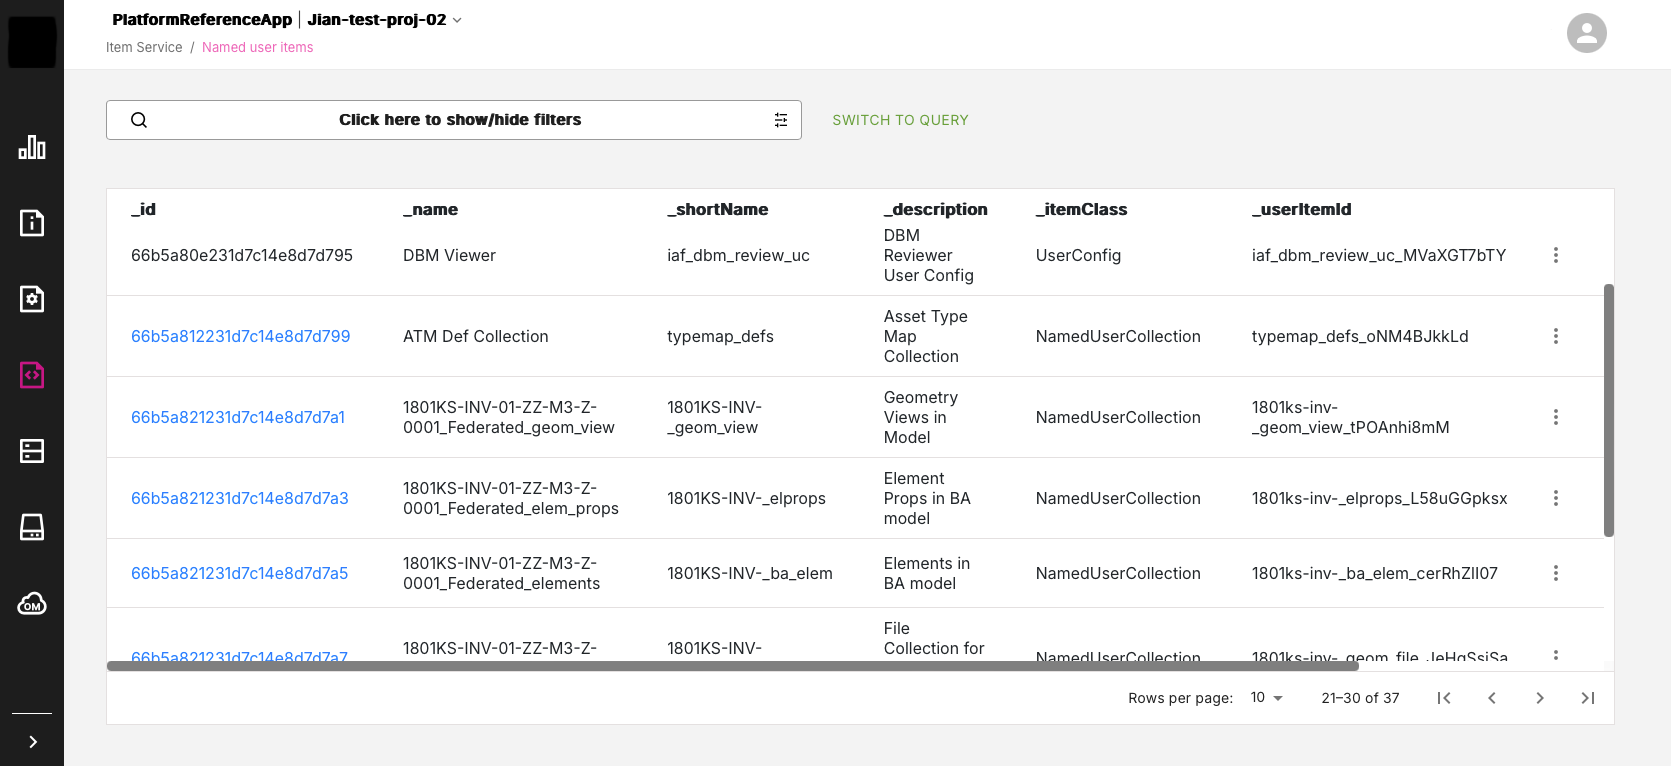
Note: You can click and drill down on an item entry whenever the ID field is marked in blue, indicating it is a drill-down link.
Related Items Query page#
When you open the Related Items Query page, you are presented with a text query box on the top of the screen on the Query Related Items tab. You can use this text box to enter MongoDB-like queries on related items.
You can also select the Query Relations tab and enter commands there to query the relationships between items.
At the bottom of the page, is the Query Results panel, where you see query results in JSON, Graph or Table format.
Figure: Related Items Query page
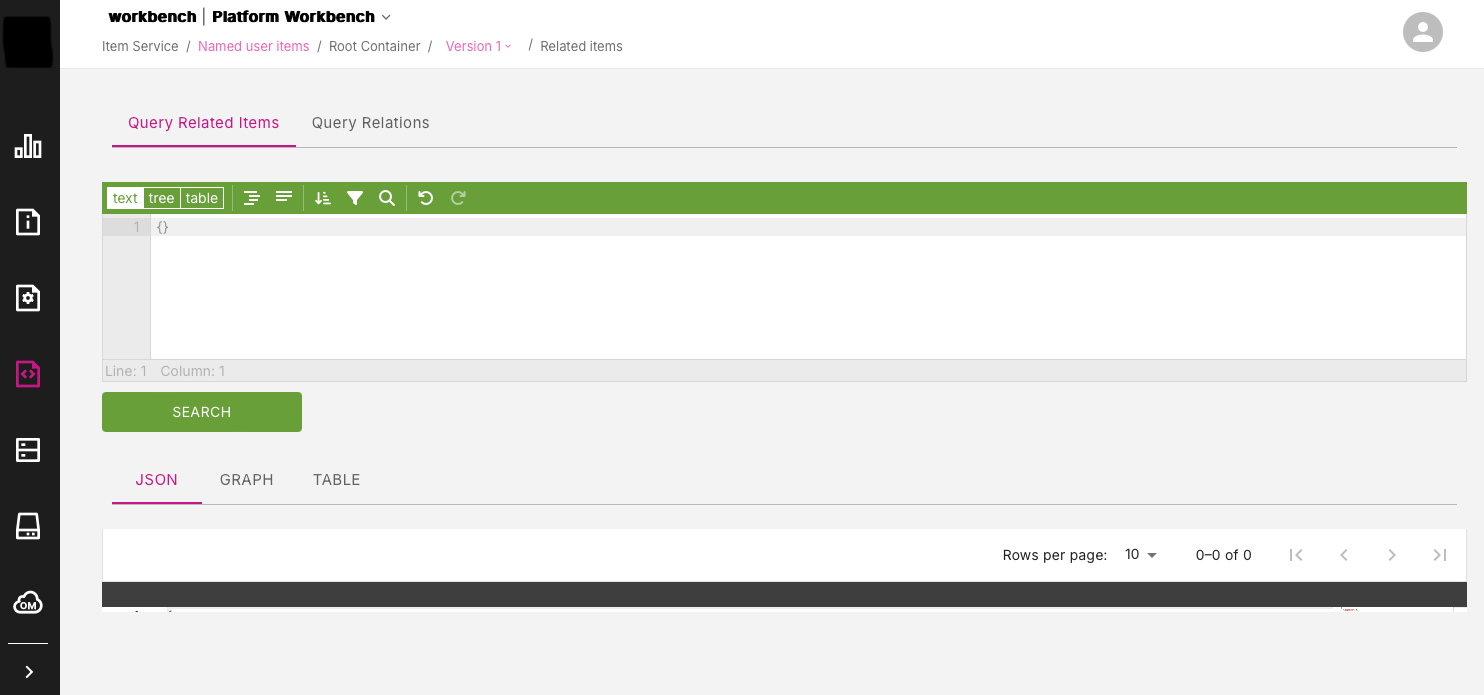
Note: For NamedFileCollection, NamedUserCollection, and NamedTelemetryCollection item types, you are presented with the page as shown above with two query tabs: Query Related Items and Query Relations. However, if you drill-down from a NamedCompositeItem, you will be presented with just one query tab: Query Related Collections.
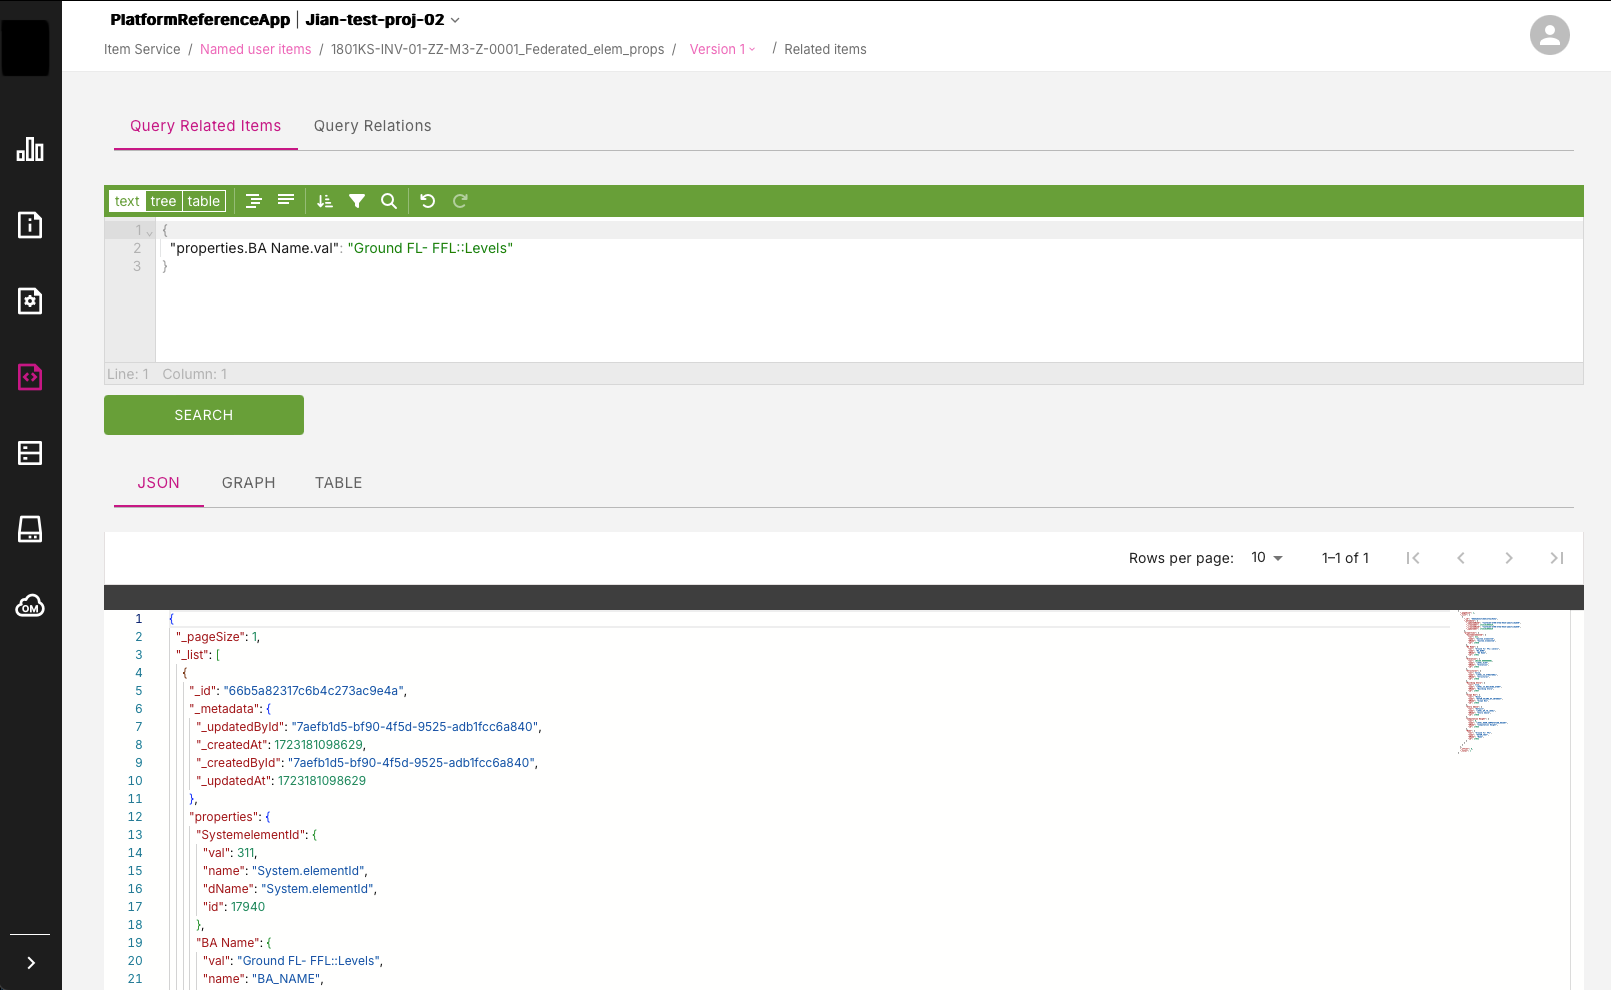
MongoDB Queries#
In the text box, on the Query Related Items tab, you can enter MongoDB queries to retrieve information on related items.
For example, the query below will retrieve all the related items that have a property path of properties.BA Name.val (separated by .) and the value of Ground Fl- FFl::Levels.
{ "properties.BA Name.val": "Ground FL- FFL::Levels"}Figure: Example MongoDB query and JSON result
Query Results panel#
At the bottom of the page, you can see the Query Results panel. This can display query results in different formats, depending on the collection item class selected.
The main formats available are arranged across three tabs, namely:
- JSON
- Graph
- Table (mainly used for Named Telemetry Collection item classes)
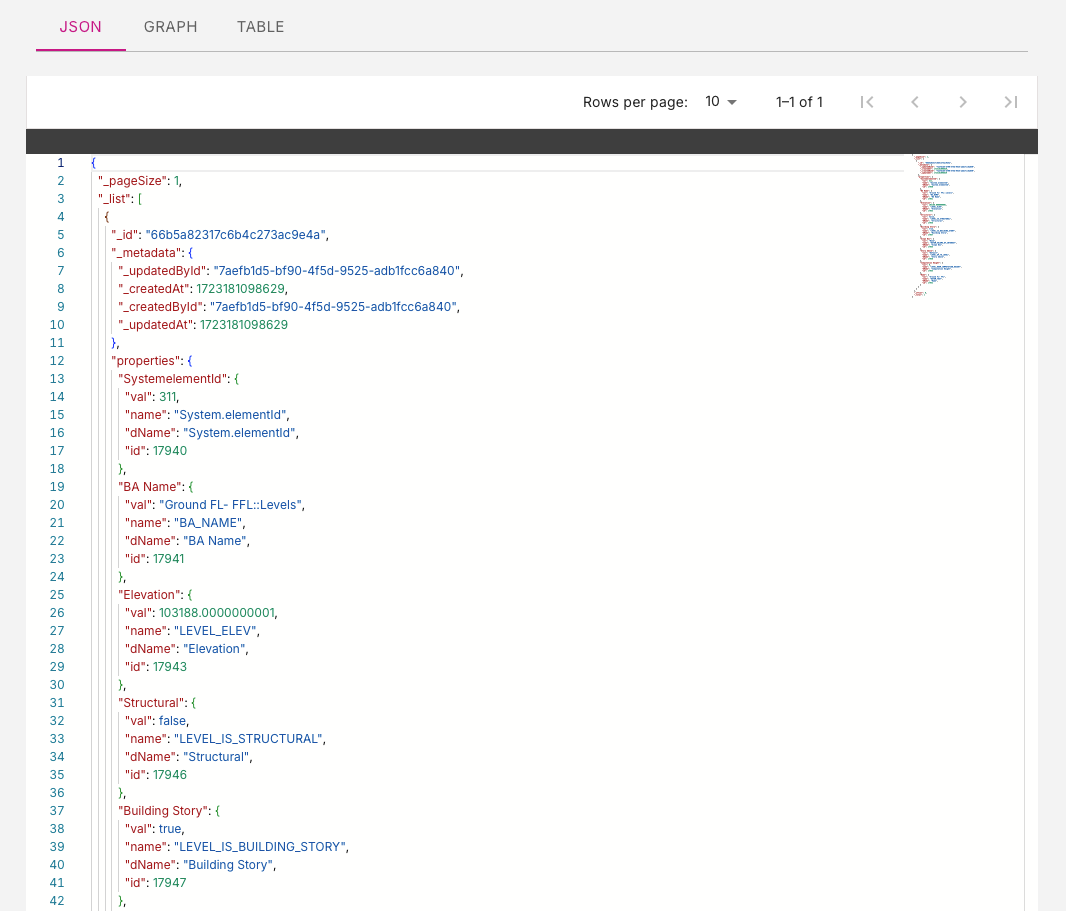
JSON#
On the JSON tab, you can view the query results in JSON format. The results may be displayed across multiple pages and require scrolling down to view the JSON listing in full.
Figure: Query result in JSON format
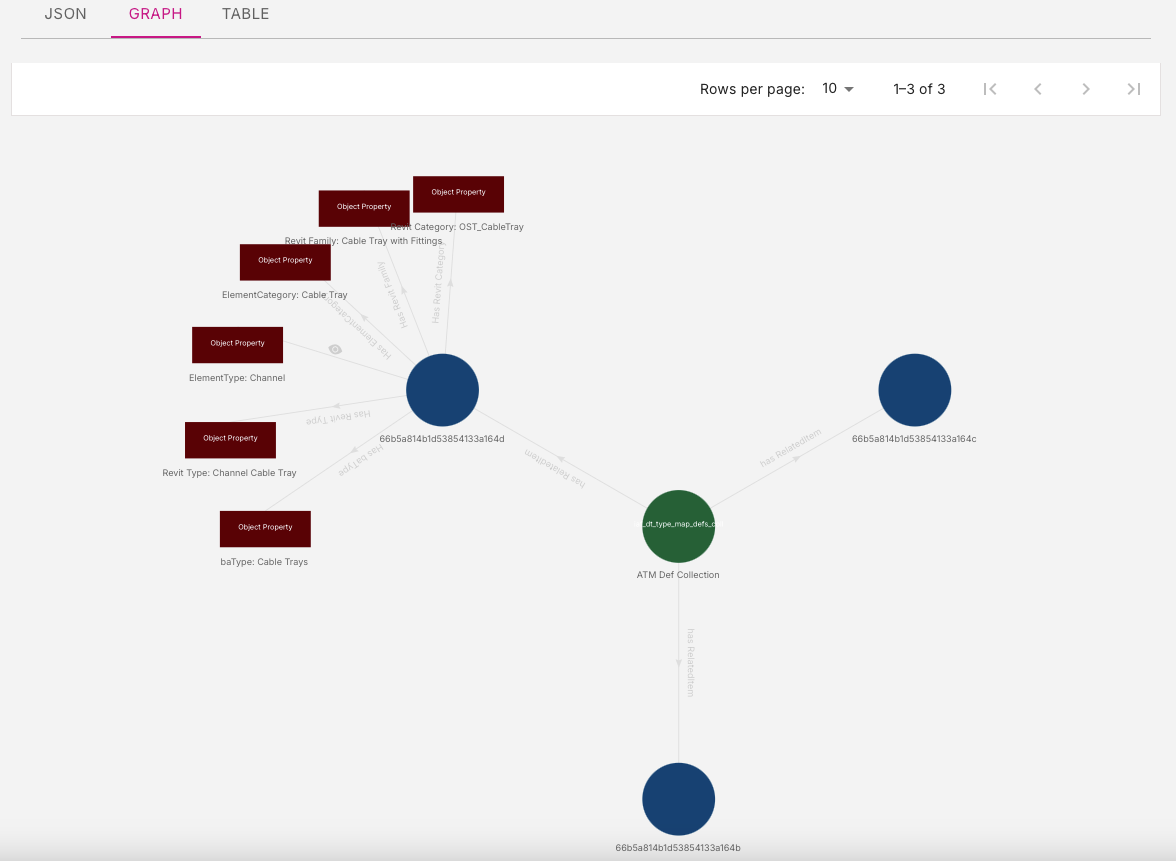
Graph#
On the Graph tab, you can view relationship information via a knowledge graph style diagram. Double-click on graph nodes to reveal other relationships in the graph hierarchy.
Figure: Query result as a knowledge graph
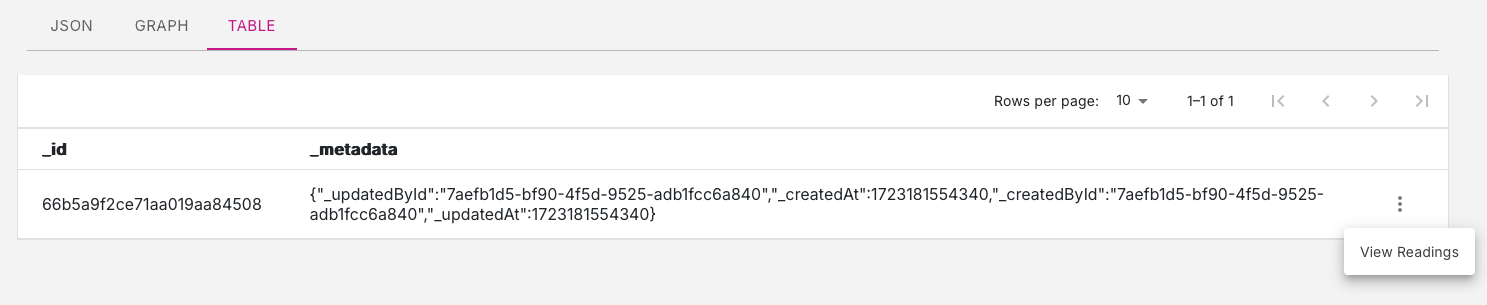
Table#
The Table tab is mainly used for the Named Telemetry Collection item class. Results are displayed in rows and when you click on the three-dot menu on the right of a row, you will be presented with the View Readings option. This option allows you to view telemetry data from a device sensor.
Figure: View Readings option for Named Telemetry Collection