Data Sources Service
Overview#
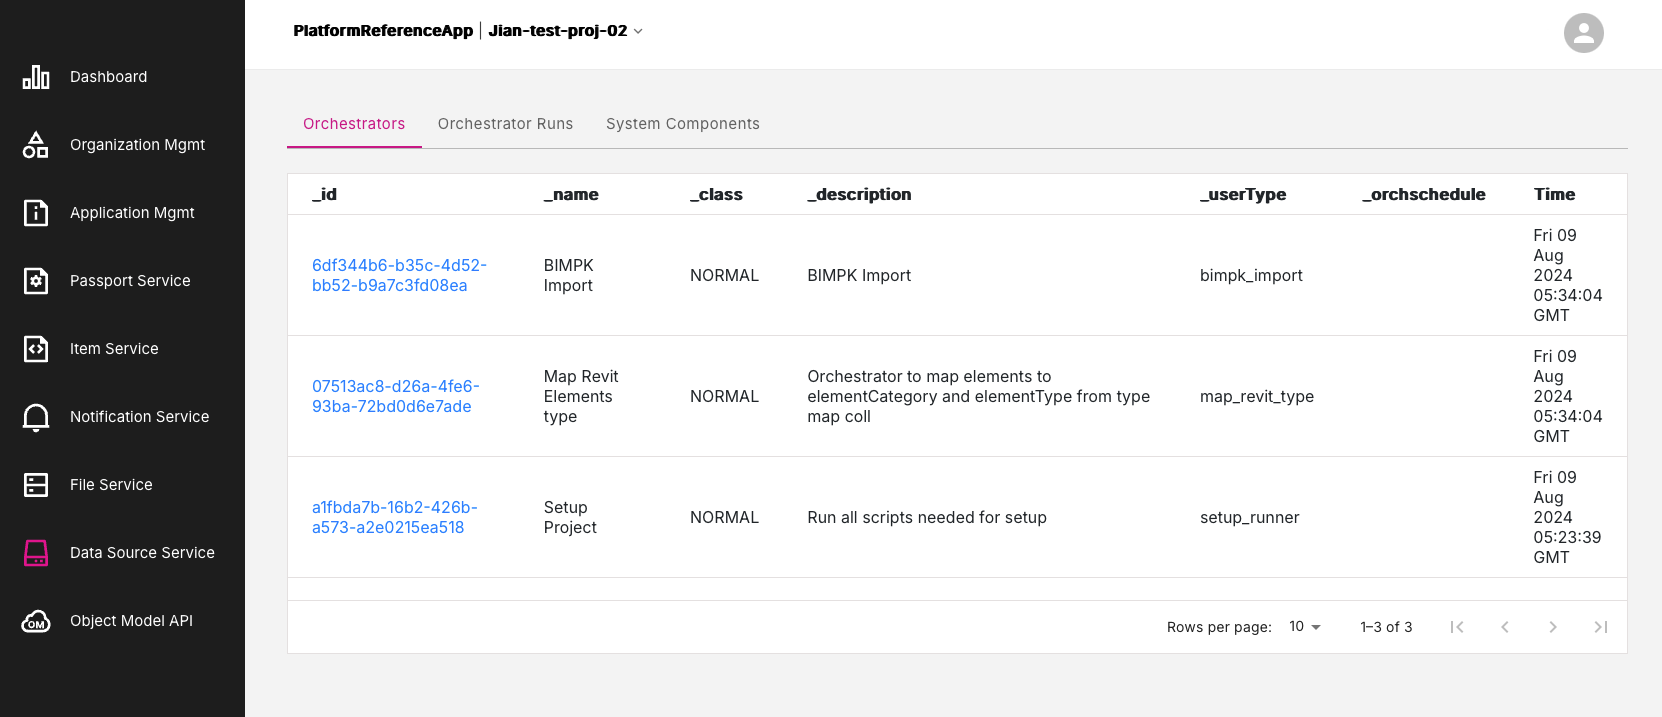
The Data Sources Service provides a list of orchestrators and orchestor runs, and provides other information on system components.
Figure: Data Sources Service page
Data Sources Service tabs#
The Data Sources Service offers three tabs of information:
Orchestrators tab#
The Orchestrators tab presents a list of platform orchestrators and list the times that the operations were run.
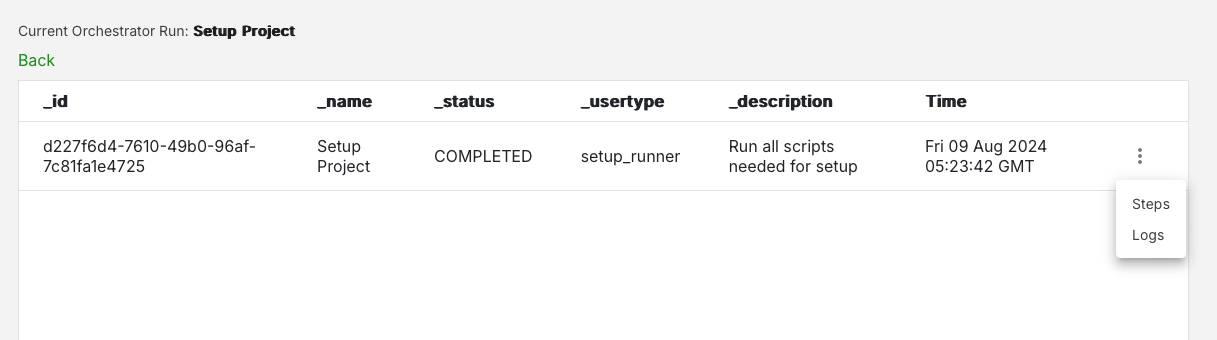
In the _id column, click on any orchestrator run entry marked in blue, to drill-down and view more detailed information about that particular orchestrator run. This information will appear in the Current Orchestrator Run page.
Figure: Current Orchestrator Run page
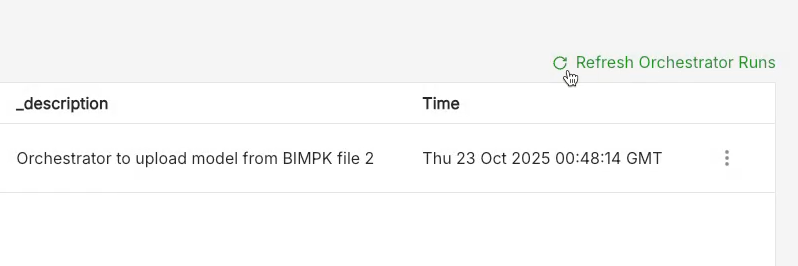
Refresh Orchestrator Runs#
The Refresh Orchestrators Runs button sits in the top-right area of the Orchestrators tab. Click this button to update the list of records of orchestrator runs to show the latest status of each run.
Figure: Refresh Orchestrator Runs button
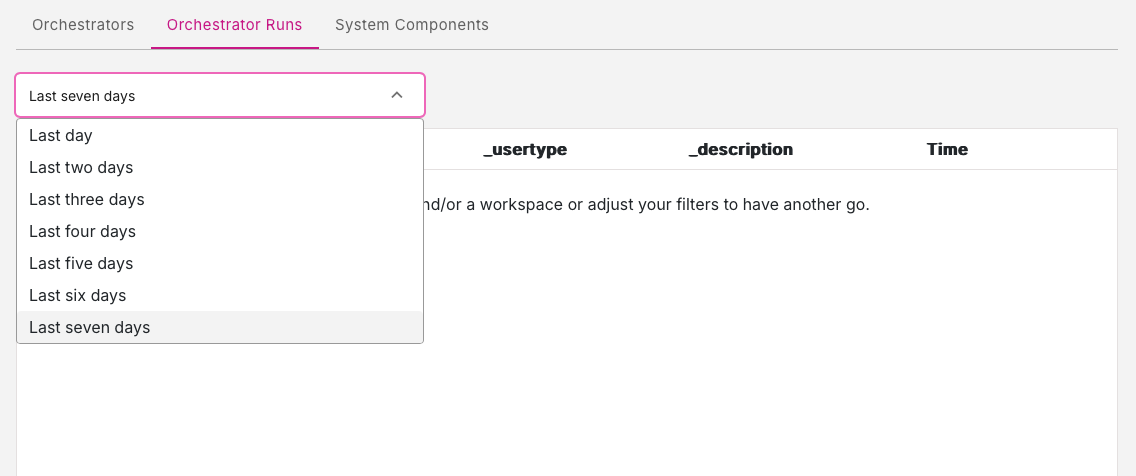
Orchestrator Runs tab#
This tab presents a list of the orchestrator runs in the workspace. If you do not see any entries on this page then try adjusting the time period by selecting different time ranges using the down-menu near the top of the tab. You can view orchestor runs from the previous seven days.
System Components tab#
This tab presents a list of the system components involved in the orchestrator runs.
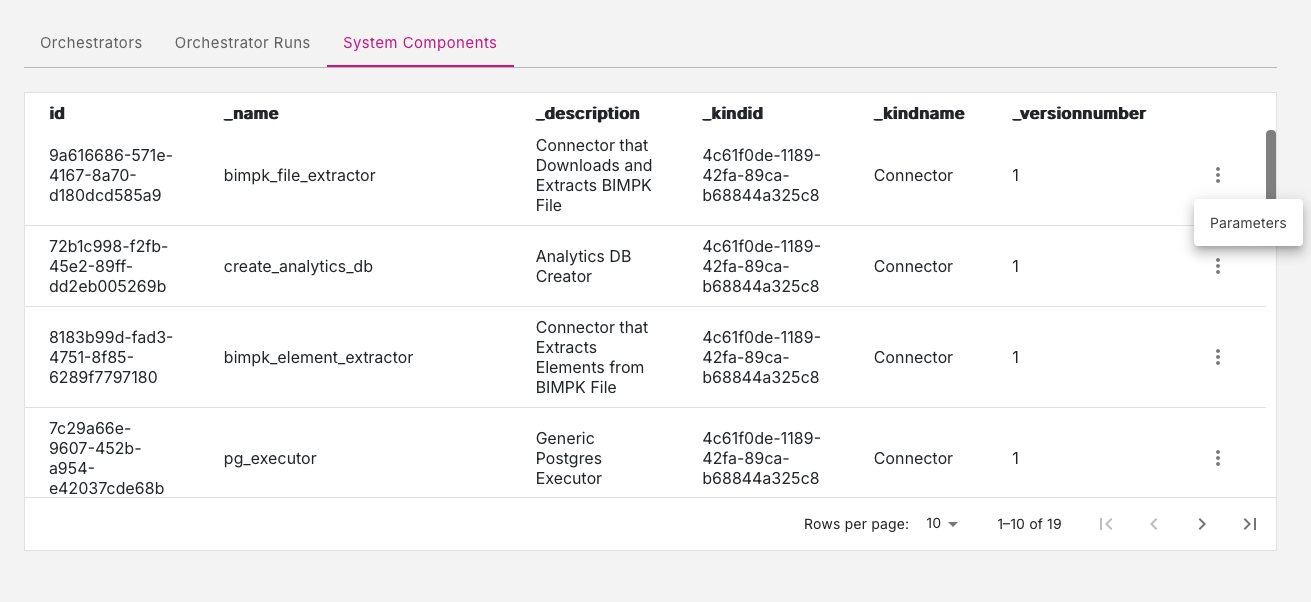
Parameters option#
Each system component entry has a three-dot menu icon. Click this icon to reveal one option: Parameters.
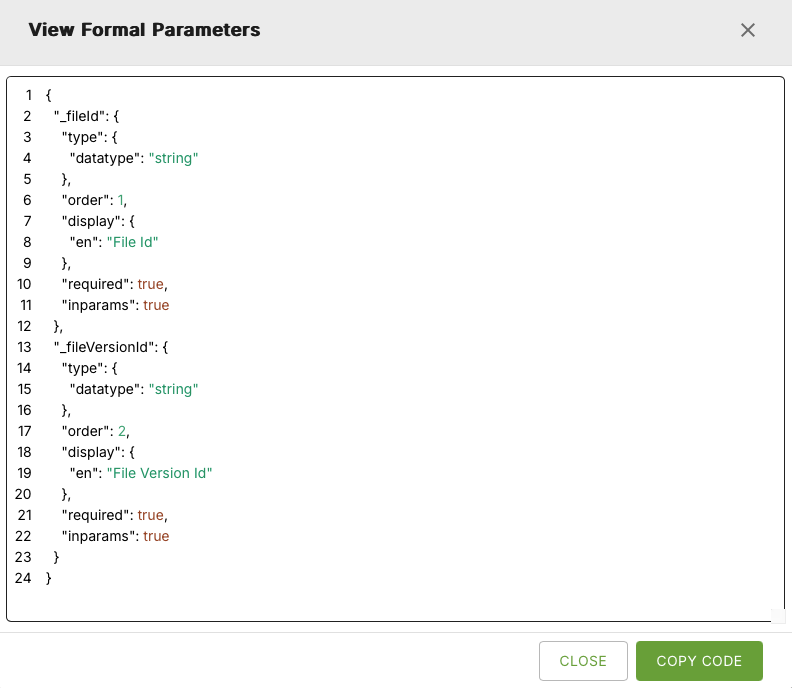
This will present you with a list of the formal parameters used for a particular system component. Use the Copy Code button to easily copy the list of parameters.
Three-dot menu options#
On the Current Orchestrator Run page and on the Orchestrator Runs page, each orchestrator run listing has a three-dot menu icon. Click this icon to reveal these options:
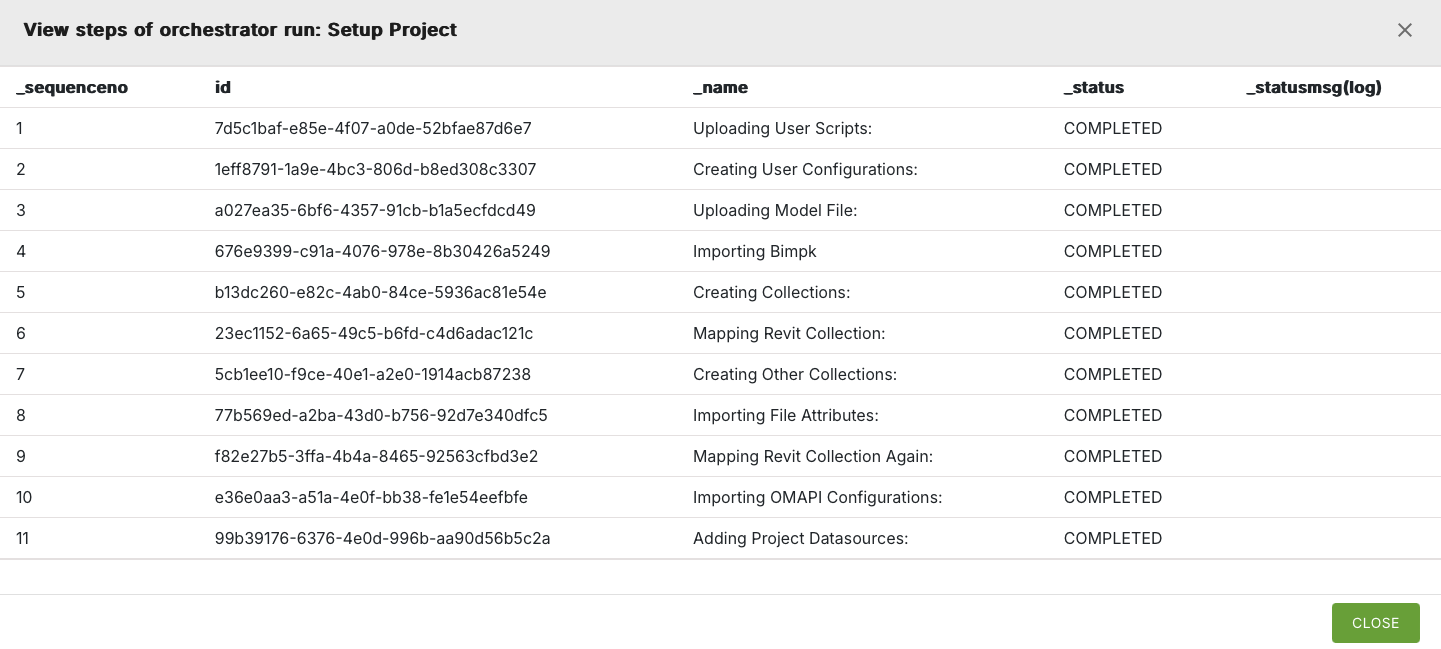
Steps option#
Click the Steps option to view the steps involved in a particular orchestrator run.
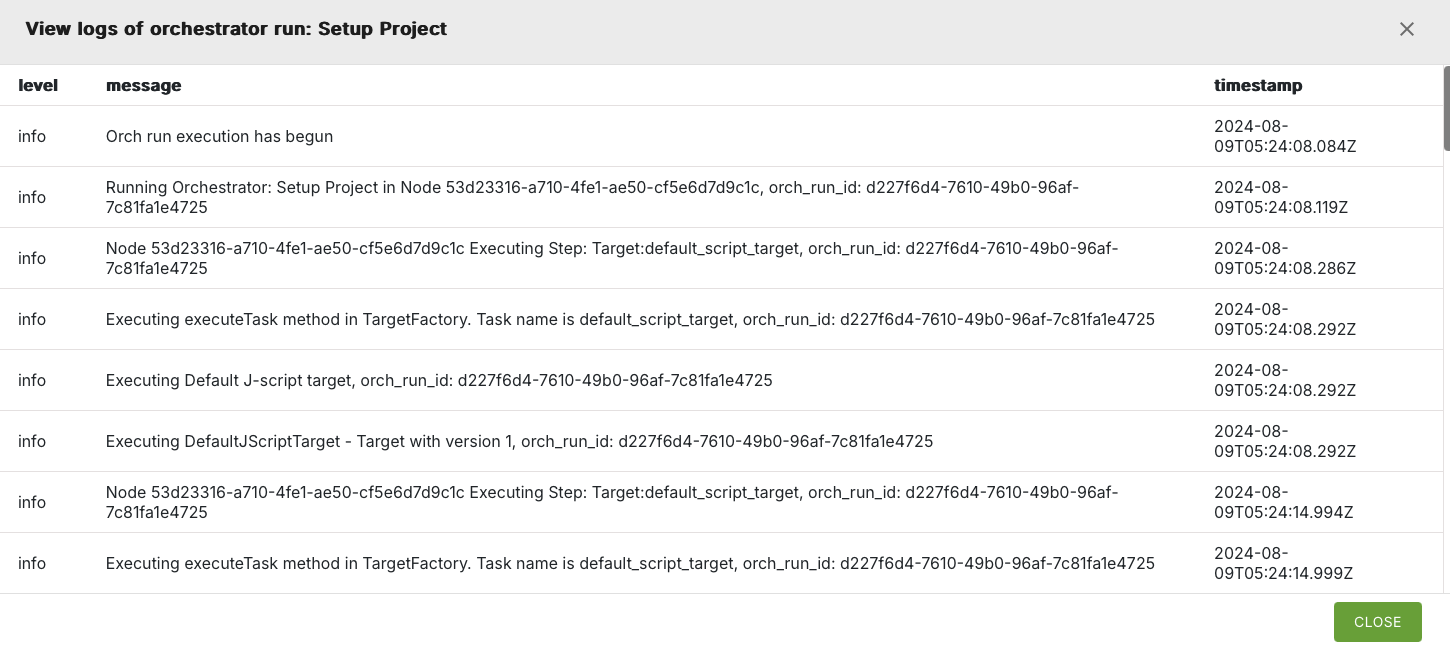
Logs option#
Click the Logs option to view the system logs for a particular orchestrator run.
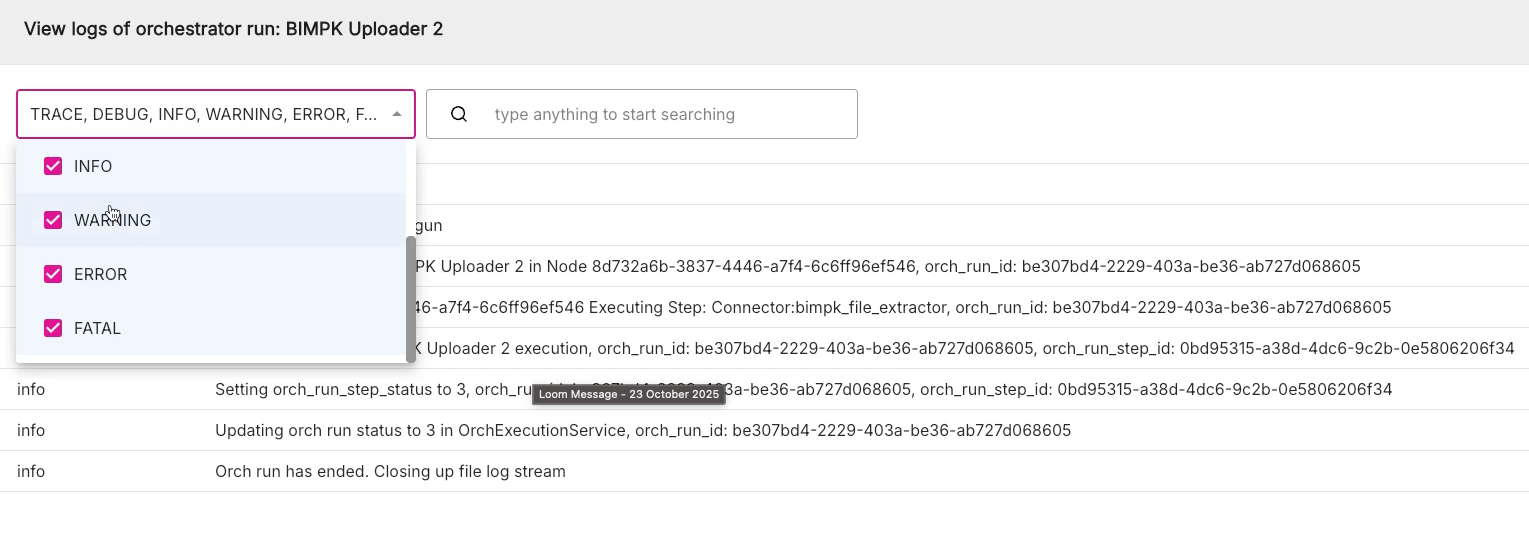
Filtering options for logs#
Introduced in Console App 3.5, there are two additional fields at the top of the logs screen, which allow you to do the following:
- Filter using status Level - In the drop-down list on the left. check the boxes for each status level type you want listed such as INFO, WARNING, ERROR, FATAL etc.
- Filter using client-side filtering - In the text box on the right, enter text for a search term or partial search term for client-side filtering of orchestrator runs. This is useful for searching through log messages for key terms.
Figure: Filter by selecting status levels
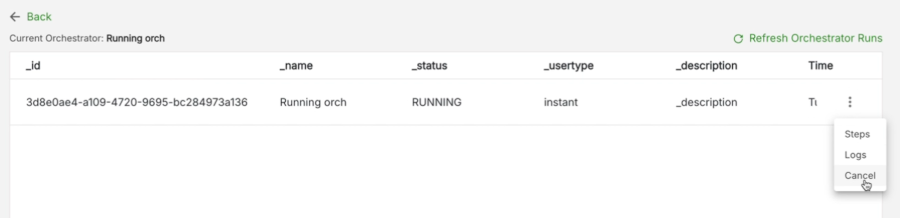
Cancel option#
On the Current Orchestrator Run page and on the Orchestrator Runs page, you can now cancel an orchestrator run while it is in progress.
For any orchestrator run which has a current status of RUNNING, in the three dot menu there will be an additional option Cancel. Simply click Cancel to stop the orchestrator run.
Figure: Cancel orchestrator run option