Dashboard
Overview#
The Dashboard console presents a visual and data-driven overview of all of the Console App services, listing information such as Workspace count, User Group count, or Item count for each service.
Figure: Dashboard landing page
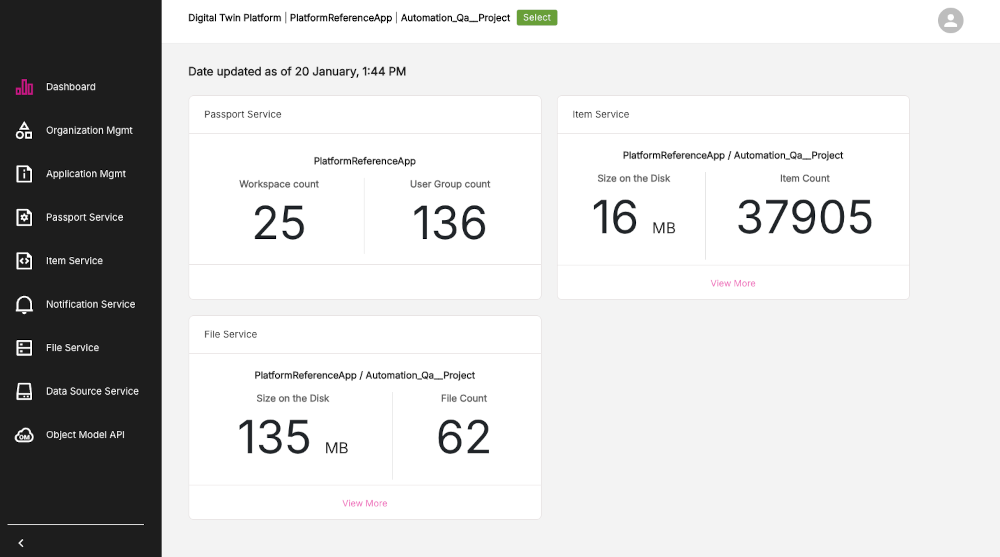
Under the panel for each of the Console App services, such as the Item Service, you may see the option View More. Click this option to view a more detailed listing of information for that particular service.
Welcome modal window#
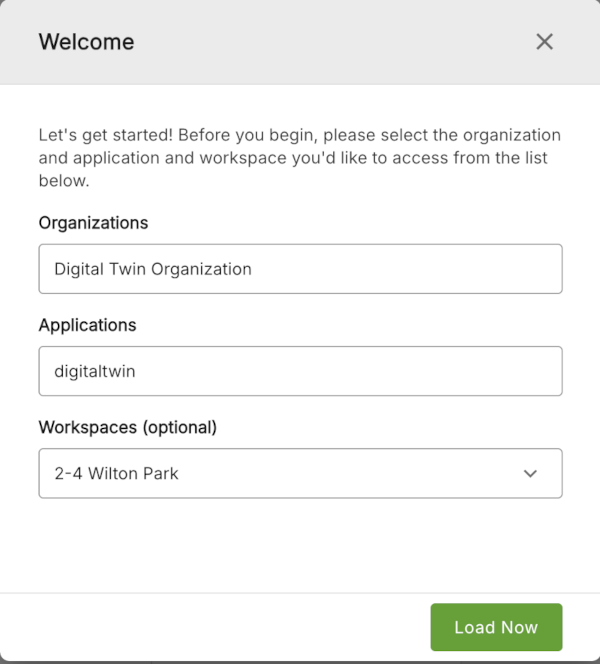
Click the Select button at the top of the page to open the Welcome modal window where you can select organizations, applications, and workspaces. The Select button is available throughout the main sections of the Console app and is an easy way to select and change organizations etc.
The Welcome modal will be pre-populated with information based on your previous session and the organization you have selected. Click the Load Now button to load up the organization that you have selected.
Figure: Welcome modal window
Notification windows#
Various notification pop-up windows can appear throughout the Console App informing you about some relevant information. You can now close these windows by clicking the X on the right-side of the window.
Figure: Example notification window
